The Generated Reports page shows all your standard reports that have been created or are currently being processed. View report status, download completed CSV files, filter reports by date or type, and manage your report history. All reports are generated as CSV files that you can download and analyze in Excel or other tools.
View all your generated reports in one place. See report status, generation dates, and download links without navigating multiple pages.
Monitor report processing in real-time. See when reports are pending, processing, completed, or if errors occurred. Use the refresh button to check status updates.
Quickly find specific reports using filters. Search by report ID, name, description, date range, period, or status. Filter multiple columns at once to narrow down results.
Download completed reports instantly. All reports export as CSV files, making them easy to open in Excel, Google Sheets, or any data analysis tool for further processing.
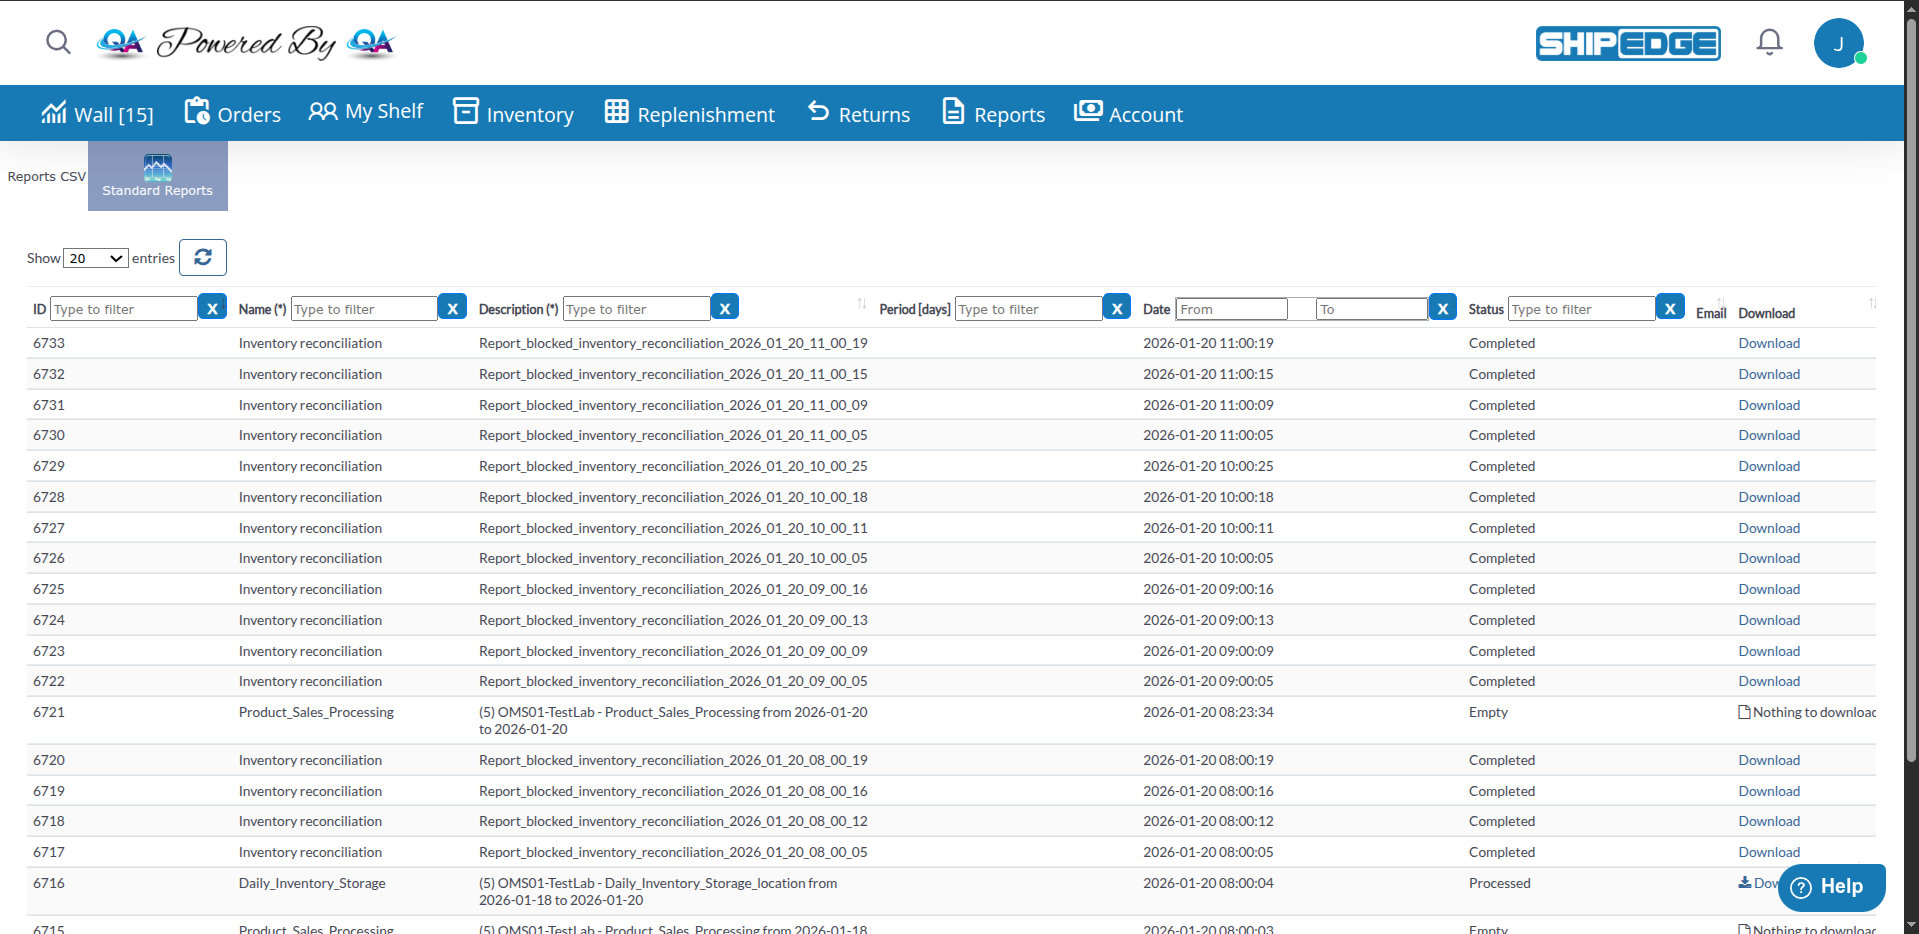
This page displays a comprehensive table with all your reports and their current status.
-
Access Reports List
Navigate to generated reports from the Reports menu or by clicking the Generated button in the page header. The page title shows “Reports CSV”.
-
Understand the Reports Table
The table displays all generated reports with the following columns:
- ID: Unique report identifier
- Name (*): Report type name (searchable)
- Description (*): Full description including account, date range, and filters (searchable)
- Period [days]: Number of days covered by the report
- Date: Date and time when the report was generated
- Status: Current processing status
- Email: Email address if the report was sent via email
- Download: Action column with download links or status indicators
-
Use Table Filters
Use the built-in filters at the bottom of each column to find specific reports:
- ID: Filter by report ID number
- Name: Search by report name
- Description: Search within descriptions
- Period: Filter by number of days
- Date: Use date range picker to filter by generation date
- Status: Filter by status (Pending, Processing, Completed, Empty, Error)
-
Refresh the List
Click the refresh button (🔄) next to the page length selector to reload the table and check for status updates.
-
Navigate to Report Generation
Click the Standard Reports button in the page header to navigate to the principal page and generate new reports.
Reports can have one of five statuses, each with different actions available:
Pending
- Report is queued for processing
- Shows spinner icon (⏳) and “Wait please” message
- No action needed, wait for processing to complete
- Check back in a few minutes
Processing
- Report is currently being generated
- Shows spinner icon (⏳)
- Wait for completion (can take up to 3 hours for large reports)
- The table automatically refreshes to show status updates
Completed
- Report is ready for download
- Shows Download link
- Click to download the CSV file immediately
- File downloads automatically to your computer
Empty
- No data found for the selected criteria
- Shows file icon (📄) and “Nothing to download” message
- Review your date range and filters
- Try generating again with different parameters
Error
- Report generation failed
- Shows DELETE link in red
- Click DELETE to remove the failed report entry
- Try generating again with the same or different parameters
To generate new reports, click the Standard Reports button in the Generated Reports page header. This takes you to the report generation interface where you can create new reports.
The modern interface provides an easy-to-use card-based system for generating reports.
-
Open Report Generation Page
Click Standard Reports button from the Generated Reports page header, or click Reports from the Reports menu.
-
Navigate Between Tabs
The page has two tabs:
- Standard: Pre-built report templates (default)
- Advanced: Advanced reports requiring replica database server
-
Select Report Type
Browse available reports organized in cards. Each card shows:
- Report name and description
- Icon representing the report type
- View button to configure parameters
- Schedule button for automated runs (if schedules exist, shows badge with clock icon)
-
Configure Report Parameters
Click View on any report card to open the configuration modal:
- Account: Select account from dropdown (required for multi-account users)
- Date Range: Use the date range picker to select start and end dates
- Report Name: Optional custom name for the report
- Filters: Apply report-specific filters if available (varies by report type)
- Order Status: Filter by order status if applicable
-
Generate or Schedule Report
Choose your action:
- Click Generate to create the report immediately
- Click Schedule to set up automated recurring reports
- Click Cancel to close without generating
-
Monitor Report Status
After generating, navigate to Generated Reports pages to see your report in the queue. The status will update automatically as processing completes.
Shipped Orders
- Shows all orders that have been shipped
- Includes: Company name, order date, ship number, order number, reference number, carrier, shipping method, tracking number, shipped date, customer information (name, company, address, city, state, zip, country, email, phone), COD amount
Product Sales Processing
- Products sold and processed during the period
- Includes: Company name, channel, ship number, order number, reference number, SKU, UPC, description, quantity, sold price, processed date
Shipped Products (Lot/expir/UOM)
- Shipped products with detailed tracking information
- Includes: Company name, cart name, ship number, order number, reference number, SKU, UPC, description, quantity, shipped date, bin, lot number, expiration date, unit of measure
Shipped Orders with RMA
- Orders that have been shipped and include return merchandise authorization
- Useful for tracking returns and exchanges
Daily Inventory Storage
- Daily snapshot of inventory levels
- Includes: SKU, UPC, description, product quantity, lot number, expiration date, unit of measure, bin tag, location, date
- Can be grouped by Bin or Location when generating
SKU Inventory History
- Historical inventory changes for specific SKUs
- Includes account selection and date range filtering
Daily Inventory Changes
- Changes in inventory levels over time
- Limited to 90 days maximum date range
- Shows additions, removals, and adjustments
Idle SKUs
- SKUs that haven’t moved in the last 15 days
- End date is automatically set to today
- Helps identify stagnant inventory
All Bins
- Complete list of all bins in the warehouse
- No date range required (WMS users only)
- Shows bin locations and current status
Inventory Adjustment
- All inventory adjustments made during the period
- Includes adjustment details, reasons, and timestamps
- Useful for audit trails
Shipping Cost
- Analysis of shipping costs
- Includes cost breakdown by order and shipping method (WMS users only)
Holistic Shipping Spend
- Total shipping spend across all accounts
- Available to Admin users only
- Provides system-wide shipping cost overview
Shipping Spend Report by Carrier
- Shipping costs broken down by carrier
- Useful for carrier comparison and cost analysis
Base Rate
- Base shipping rates configured in the system
- Shows rate structure and pricing (WMS users only)
- Useful for rate management
Shipped Boxes
- Information about boxes shipped
- Includes box dimensions, weight, and shipping details
- Useful for packaging analysis
Ledger Transactions Log
- Complete log of all financial transactions
- Includes: Company name, transaction type, ID, description, cost, timestamp
All Transactions
- Comprehensive transaction report
- Includes all transaction types and details
- Available when 3PL Billing module is activated (WMS users)
Statement
- Account statements for billing periods
- Includes charges, credits, and account balance
- Useful for billing reconciliation
Replenishment Report
- Replenishment requests and their status
- Can filter by replenishment status (Processing, Ready for Review, Processed, Arrived, Partially Processed, Archived)
- Helps manage inventory replenishment workflow
Picking Log
- Log of picking activities
- Shows picking times, quantities, and locations
- Available when Picking Log module is activated
- Useful for warehouse efficiency analysis
Manufacture Orders
- Manufacturing orders and their status
- Includes production details and completion dates
Product Serials
- Serial numbers for products
- Useful for tracking individual items
Routing Orders
- Orders that have been routed
- Shows routing information and status
- Useful for multi-warehouse operations
Reports are processed in the background. Processing time depends on:
- Report type complexity
- Date range selected
- Amount of data to process
- System load
Typical processing times:
- Simple reports (single account, short date range): 1-5 minutes
- Complex reports (all accounts, long date range): 15 minutes to 3 hours
- Very large reports: Up to 3 hours
The reports table includes:
Pagination
- Default: 20 reports per page
- Options: 10, 20, 50, 100, 200, 500, 1000, 1500, 2000, 2500, 5000
- Use the dropdown at the bottom left to change page size
Sorting
- Click column headers to sort
- Default sort: Report ID (descending - newest first)
- All columns are sortable
Search and Filter
- Individual column filters for precise searching
- Date range filter for the Date column
- Text filters for ID, Name, Description, Period, and Status
- Filters work together (AND logic)
Refresh
- Click the refresh button (🔄) to reload data
- Useful for checking status updates without full page reload
Select date ranges that match your reporting needs. Shorter ranges process faster. For monthly reports, use preset options like “Last 1 Month” instead of custom dates spanning 30+ days.
Large reports can take time to process. Use the refresh button to check status updates. Reports remain available for download once completed.
Download completed reports as soon as possible. While reports are stored in the system, it’s best practice to download and archive important reports locally for your records.
For reports you need regularly, use the scheduling feature in the modern interface. Set up automated reports to run daily, weekly, or monthly. Scheduled reports appear with a clock badge on the report card.
Delete reports with “Error” status to keep your reports list clean. Failed reports can’t be downloaded, so removing them helps you focus on successful reports.
Report Stuck on “Pending” or “Processing”
- Reports process in the background and can take time
- Wait at least 15 minutes before checking again
- Very large reports (all accounts, long date ranges) can take up to 3 hours
- Use the refresh button to check for status updates
- If stuck for more than 3 hours, contact support
Report Shows “Empty” Status
- No data matches your selected criteria
- Try expanding the date range
- Check if the account selection is correct
- Verify that data exists for the selected period
- Review filters applied during generation
Report Shows “Error” Status
- Generation failed due to system error or data issue
- Click DELETE link (in red) to remove the failed report
- Try generating again with the same or different parameters
- If errors persist, contact support with the report ID
Can’t See Expected Report Types
- Some reports are only available based on your user level
- WMS-only reports (All Bins, Base Rate, Shipping Cost) require WMS user level (level 2)
- Admin-only reports (Holistic Shipping Spend) require Admin level (level 3)
- Some reports require specific modules to be activated (e.g., Picking Log, 3PL Billing)
- Check with your administrator if you need access to additional reports
Download Link Not Working
- Ensure the report status is “Completed” (not Processing or Pending)
- Try refreshing the page using the refresh button
- Check your browser’s download settings and pop-up blockers
- If the file is very large, download may take time - be patient
- Try a different browser if issues persist
Can’t Generate Report
- Click the Standard Reports button to access the generation interface
- Verify all required fields are filled
- Check that you have permission to generate reports
- Ensure your account is active
- Check browser console for JavaScript errors
Filters Not Working
- Ensure you’re typing in the correct filter box for each column
- Date filters require selecting both start and end dates
- Clear all filters and try again
- Refresh the table if filters seem stuck
Next Steps: